Lorem ipsum dolor sit amet, consectetur adipiscing elit. Suspendisse varius enim in eros elementum tristique. Duis cursus, mi quis viverra ornare, eros dolor interdum nulla, ut commodo diam libero vitae erat. Aenean faucibus nibh et justo cursus id rutrum lorem imperdiet. Nunc ut sem vitae risus tristique posuere.
November 7, 2022
min
On-trade in Europe: Italy and Spain differences, Central Europe countries and the impact of tourism

Martin Müller
Content Lead


This is the first part of a major European countries’ comparison covered by SharpGrid data: Italy, Spain, Poland, Czechia and Slovakia. You will uncover interesting comparisons between these on-trade markets, learn about consumer behavior and discover insights and trends for various on-trade categories. Part 2 will focus on on-trade categories and part 3 will describe the difference between complex and simple proposition categories.
Southern vs central Europe: The stereotypes are true
Consumer rating is a SharpGrid Outlet Census indicator with 1 being the lowest and 5 the highest rating. This indicator aggregates various ratings from many platforms like Google, FB, Tripadvisor etc. to determine how satisfied consumers are with a place. See the values for Italy, Spain, Poland, Czechia and Slovakia in the interactive map below.
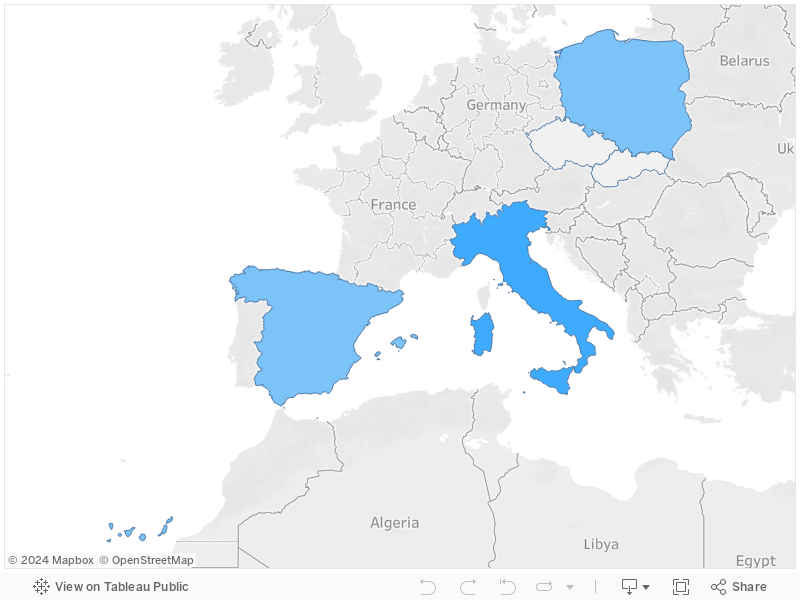
If you didn’t believe the stereotypes about the positive nature of Southern Europeans and their great food, you can finally start to.
Small difference, big impact
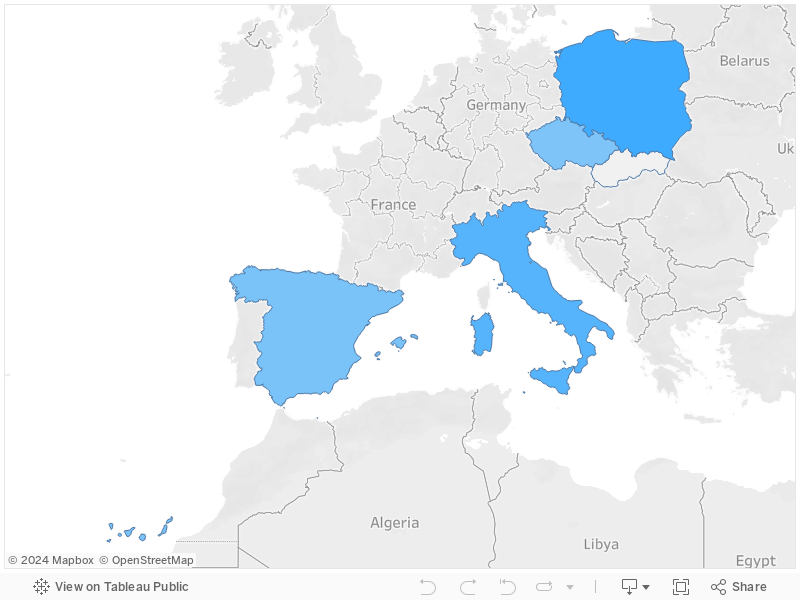
Now, this might seem like a small difference, but it is actually a big one. In SharpGrid, we track closely more than 750 000 outlets in 5 different countries and a whopping 89% of them are on a rating scale of 4-5. This means that even one decimal can make a huge difference.
We’ve also removed 10% worst and best outlets in each country from the comparison to avoid skewing the results with “extreme” values.
If the 10% were left in place, Czechia and Slovakia would increase their rating to 4.3 while the other countries’ ratings remained the same. This shows that the outlet universe in Czech & Slovakia is more heterogeneous, with a sizable segment of high-quality outlets while the average on-trade experience is substantially below the other 3 countries (be it food, service or ambience).
Central and Eastern Europe are not particularly known around the world for their cuisine (or welcoming staff for that matter). How many times have you seen typical Czech pork and dumplings or Polish Pierogi on the menu of restaurants outside their home countries?
Now compare that to pizza and pasta - you can find those almost everywhere. As we’ve shown in our previous analysis, even Poland is really big on Italian food, much more than its traditional cuisine actually.
This research confirms that Italian food is simply the uncrowned king of European cuisine, followed closely by Spain, further proven by the fact that both of these countries had 6 restaurants on the list of the world’s 50 best restaurants. We’ve analyzed them and found some surprising results that you can find here:
Data analysis of 6 best Italian restaurants
Data analysis of 6 best Spanish restaurants
The higher average rating in Poland as opposed to Czechia and Slovakia is probably caused by a relatively smaller size of the on-trade channel in Poland which on average serves more (premium) consumers and provides a better average experience (see more below in our per capita comparison), and a significantly lower share of tourists in the sample in Poland (tourists are on average more critical than locals).
The uniformity of the top 15% of performers
One specific thing caught our attention. The differences between the top 15% top performing outlets in each country are very low:
- Italy: 4.92
- Czechia: 4.92
- Slovakia: 4.89
- Spain: 4.86
- Poland: 4.86
This analysis suggests two very important points:
- The SharpGrid Outlet Census rating indicator provides consistent and comparable results across markets, even very different markets like Italy and Slovakia. For example, one can compare ratings of its on-trade customers across markets to understand in what types of outlets their brands are present
- All five markets contain great high-quality outlets at the top end, the differences between them are about the experience / quality of “average” outlets
Looking at the total outlet count for these 5 countries, the difference between the 4.3 and 4.5 rankings is over 165 000 outlets which make up 21% of the total outlet count. The gap may be different in each country but it’s generally in the ballpark. For example, in Italy, the gap between 4.3 and 4.5 is over 69 000 outlets - 19% of the total outlet count.
Southern vs central Europe: Consumer engagement
The consumer engagement score is an indicator in Outlet Census that summarizes all consumer digital interactions with an outlet like reviews, ratings, follows & likes on social media etc. The average engagement scores per outlet for our 5 countries are:
- Poland: 609
- Spain: 360
- Italy: 310
- Czechia: 277
- Slovakia: 89
While Czechia, Spain and Italy are more or less in line, Poland and Slovakia stand out on the opposite extremes of the chart which might look weird at first glance given their almost similar outlets per capita ratio as seen below:

The European tourism impact
But there is a simple explanation. If we attempt to calculate the total engagement per person in each market and we reflect the number of tourists (who stay a short time but leave on average more reviews) in each country in the calculation, we can see that the intensity of consumer engagement is much more comparable across markets:
Again, this indicates an important point that the intensity of consumer engagement appears consistent across markets and can be used to assess and compare customer base / on-trade channel potential across different international markets. Something to definitely remember if one is looking for benchmarks within the European on-trade!
However, Slovakia still clearly stands out with a very low consumer engagement rate in its on-trade channel. Outlets typically experience the highest engagement just after they open up and when their proposition / performance changes significantly. The Slovak on-trade channel is less dynamic than the other markets we cover, displaying lower outlet turnover (outlet closings and openings) and less frequent outlet profile changes.
But this can only partially explain the difference. In fact, it remains a bit of a mystery for us. We will keep digging deeper.
Similar topics:
Spanish on-trade market analysis
The most popular cocktails in Poland
SharpGrid is a data & tech company reinventing market research in the on-trade channel. The on-trade channel consists of POSs (points of sale) like restaurants or bars where food & beverage is bought and consumed, and is often also called HoReCa, on-premise, food service, out-of-home, gastro or immediate consumption (IC) channel, hospitality or on-licence.
.png)
.png)
.png)