Data analysis of 6 best Italian restaurants reveals significant gaps in their quality


The world’s 50 best restaurants were announced some time ago and so we decided to continue with our data research to find out if they are really as good as the experts say they are. A few days back we analyzed the best restaurants of Spain (with some interesting results), this time we set our sights on Italy where 6 of the 50 best restaurants are located.
SharpGrid is present in 5 European countries and it just so happens that one of them is Italy, which is internationally known for its exquisite cuisine. It is, therefore, no surprise that a panel of about 1000 experts and gourmet chefs selected 6 restaurants in Italy that are supposed to be the champions of the culinary world. But does this reflect the voice of the people? Let’s find out.
Data analysis of the best restaurants: The foundation
Our data data analysis is based on the BI tool SharpGrid Outlet Census, a complete census of the on-trade / HoReCa market with dozens of helpful insights for sales managers and representatives, marketing and branding people, trade marketing departments and many others. The data covers literally the entire market and every outlet or point of sale existing within its borders. It is also quarterly updated to capture changes and trends.
We decided to subject the 6 restaurants in question to a double test with our 2 indicators called Customer rating and Customer engagement.
- Customer engagement: The total number of digital interactions with the outlet like reviews, likes, follows and so on. Higher numbers generally indicate 2 things - either the outlet is very good (a lot of positive reviews and likes) or very bad (a lot of negative reviews and complaints).
- Customer rating: This number is an average of all ratings from dozens of digital platforms like Tripadvisor, Google Maps etc. It is the best indicator of quality and tells the story of how popular and beloved the outlet is with its customers from the ranks of ordinary people.
Now let’s look at how the expert rating fares compared to the ordinary people's experience.
The best restaurants in Italy selected for data analysis
The best restaurants in Italy according to The World’s 50 Best are:
- Lido 84 in Gardone Riviera (8th place)
- Le Calandre in Rubano (10th place)
- Uliassi in Senigallia (12th place)
- Reale in Castel di Sangro (15th place)
- Piazza Duomo in Alba (19th place)
- St. Hubertus in San Cassiano (29th place)
We looked at how their consumer engagement and consumer rating stack up against the market average and what qualitative part of the market they fall into (e.g. worst 20%, best 30%, etc.). This data analysis for restaurants will reveal whether the "vox populi" aligns with the expert opinion.
Restaurant data analysis results: Big gaps in quality
The average engagement for these 6 restaurants is over 5 times higher than the national average. This is a clear indicator that these are well-known, frequently visited places that leave a strong impression on people, whether positive or negative. But what about their quality?
We've divided Italian establishments into “quality deciles” and placed each restaurant into them so you can get a better idea of how they fare in terms of customer ratings, which directly reflect general satisfaction with the outlet. The results are as follows:
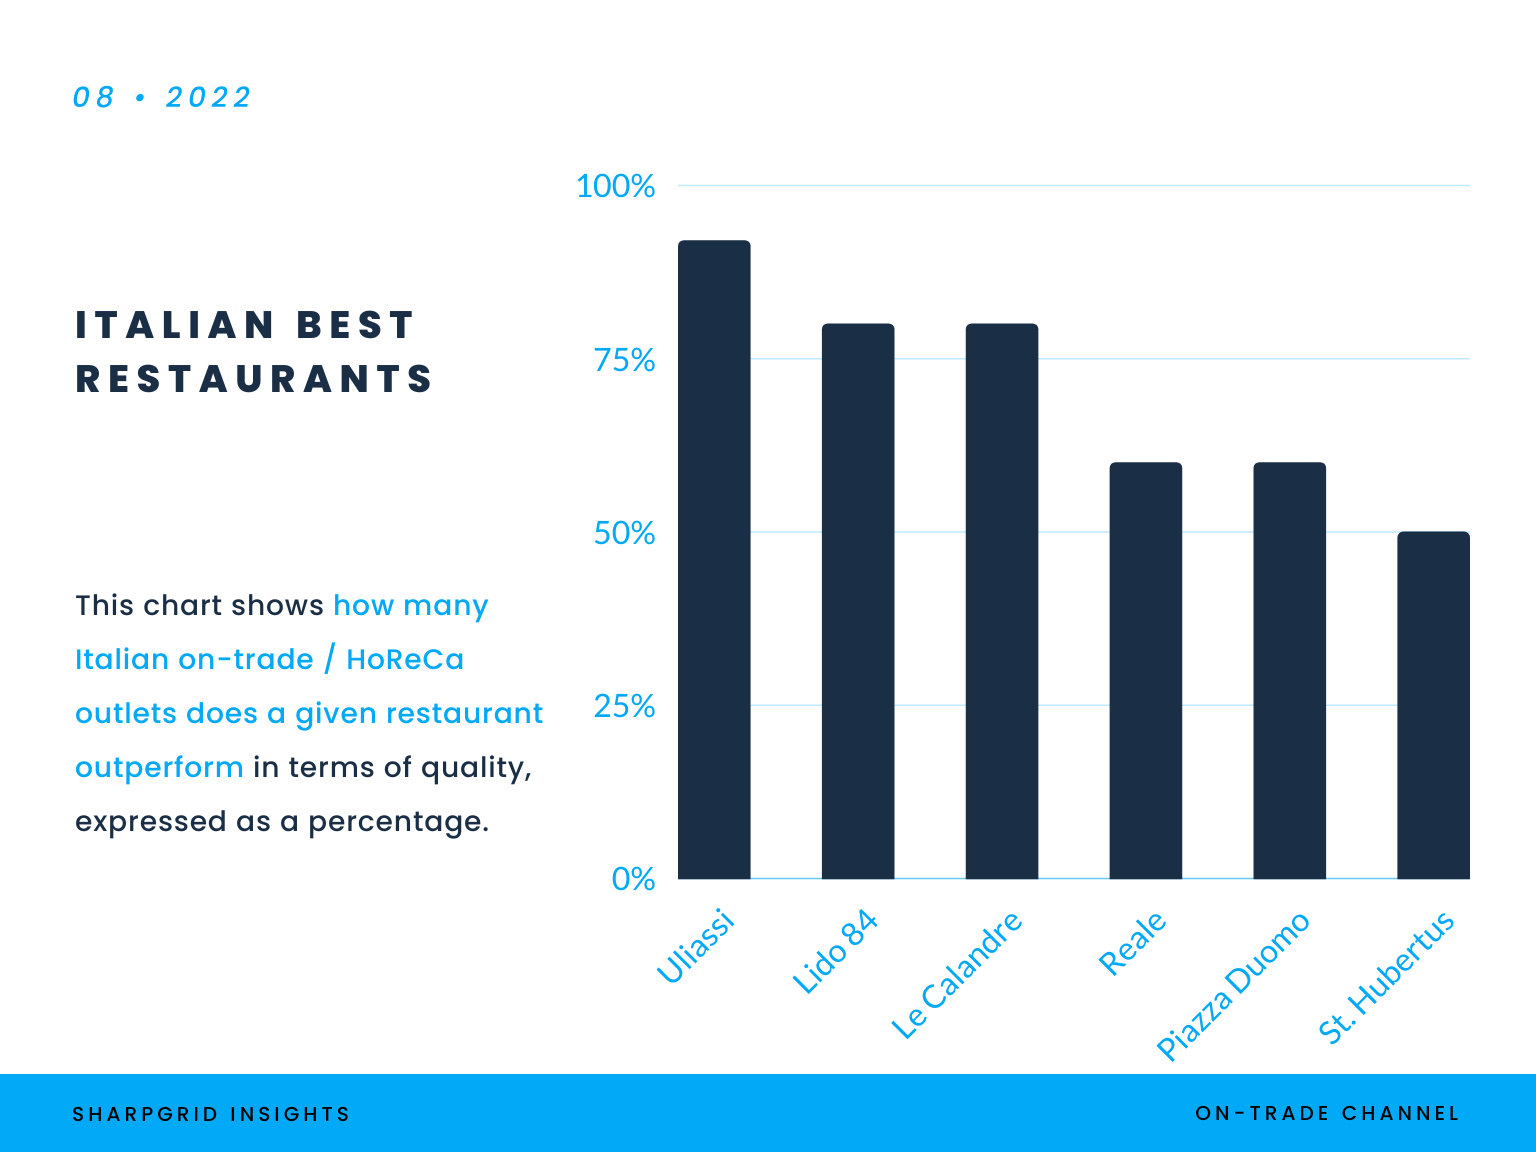
In terms of "quality deciles," the list looks like this:
- Uliassi - Top 10% of Italian restaurants
- Lido 84 - Top 20% of Italian restaurants
- Le Calandre - Top 20% of Italian restaurants
- Casadonna Reale - Top 40% of Italian restaurants
- Piazza Duomo - Top 40% of Italian restaurants
- St. Hubertus - almost precisely in the middle
To put it into perspective, a total of 164 000 outlets (out of ≈ 368000 in Italy) separate Uliassi and St. Hubertus. This means St. Hubertus rank’s is still pretty good but is no match for Uliassi. Both of them have 3 Michelin stars so theoretically they should fall into the same category of “best of the best” restaurants, but the visitors think otherwise.
A quick glance at negative reviews of St. Hubertus uncovers issues with price and portions. Some people felt they didn’t get adequate service or meal for their money. In other words, they think the restaurant is overpriced, which is something the panel of gourmets probably didn’t take into consideration.
But there could be another culprit. St. Hubertus has the lowest consumer engagement of all 6 best Italian restaurants, just a quarter of what the Uliassi restaurant has. It may mean that people are generally not that impressed with the service and cuisine and don’t leave enough positive reviews to counterbalance the negative ones. Also, St. Hubertus was founded 6 years after Uliassi, so the latter has a slight advantage in this manner.
Use data analysis to conquer the on-trade market
Generally speaking, top restaurants will be usually found among places with the highest rating, but not always as customers may have even higher (sometimes unrealistic) expectations, they may be price-sensitive or simply expect more for their money. In any way, the Consumer rating indicator in SharpGrid Outlet Census is a reliable compass that will lead you to the best on-trade outlets.
The second lesson? Consumer engagement is a great indicator for identifying places with high traffic generating a lot of responses from customers. This usually means that the place is interesting for visitors, it is trendy and a lot of people want to try it out. It may also signify that the outlet generates a lot of emotions - either positive or negative. The positivity or negativity is easily determined by the Customer rating as mentioned above.
Learn more about SharpGrid Outlet Census indicators and use cases or explore our second product called SharpGrid Market Meter - a comprehensive and live market reporting tool including market share, prices and other insights for all brands on the market, updated quarterly (same as Outlet Census).
SharpGrid is a data & tech company reinventing market research in the on-trade channel. The on-trade channel consists of POSs (points of sale) like restaurants or bars where food & beverage is bought and consumed, and is often also called HoReCa, on-premise, food service, out-of-home, gastro or immediate consumption (IC) channel, hospitality or on-licence.