From 545,000 Outlets to 28,500 Targets: The Key Outlet Indicators for Going to Market in HoReCa







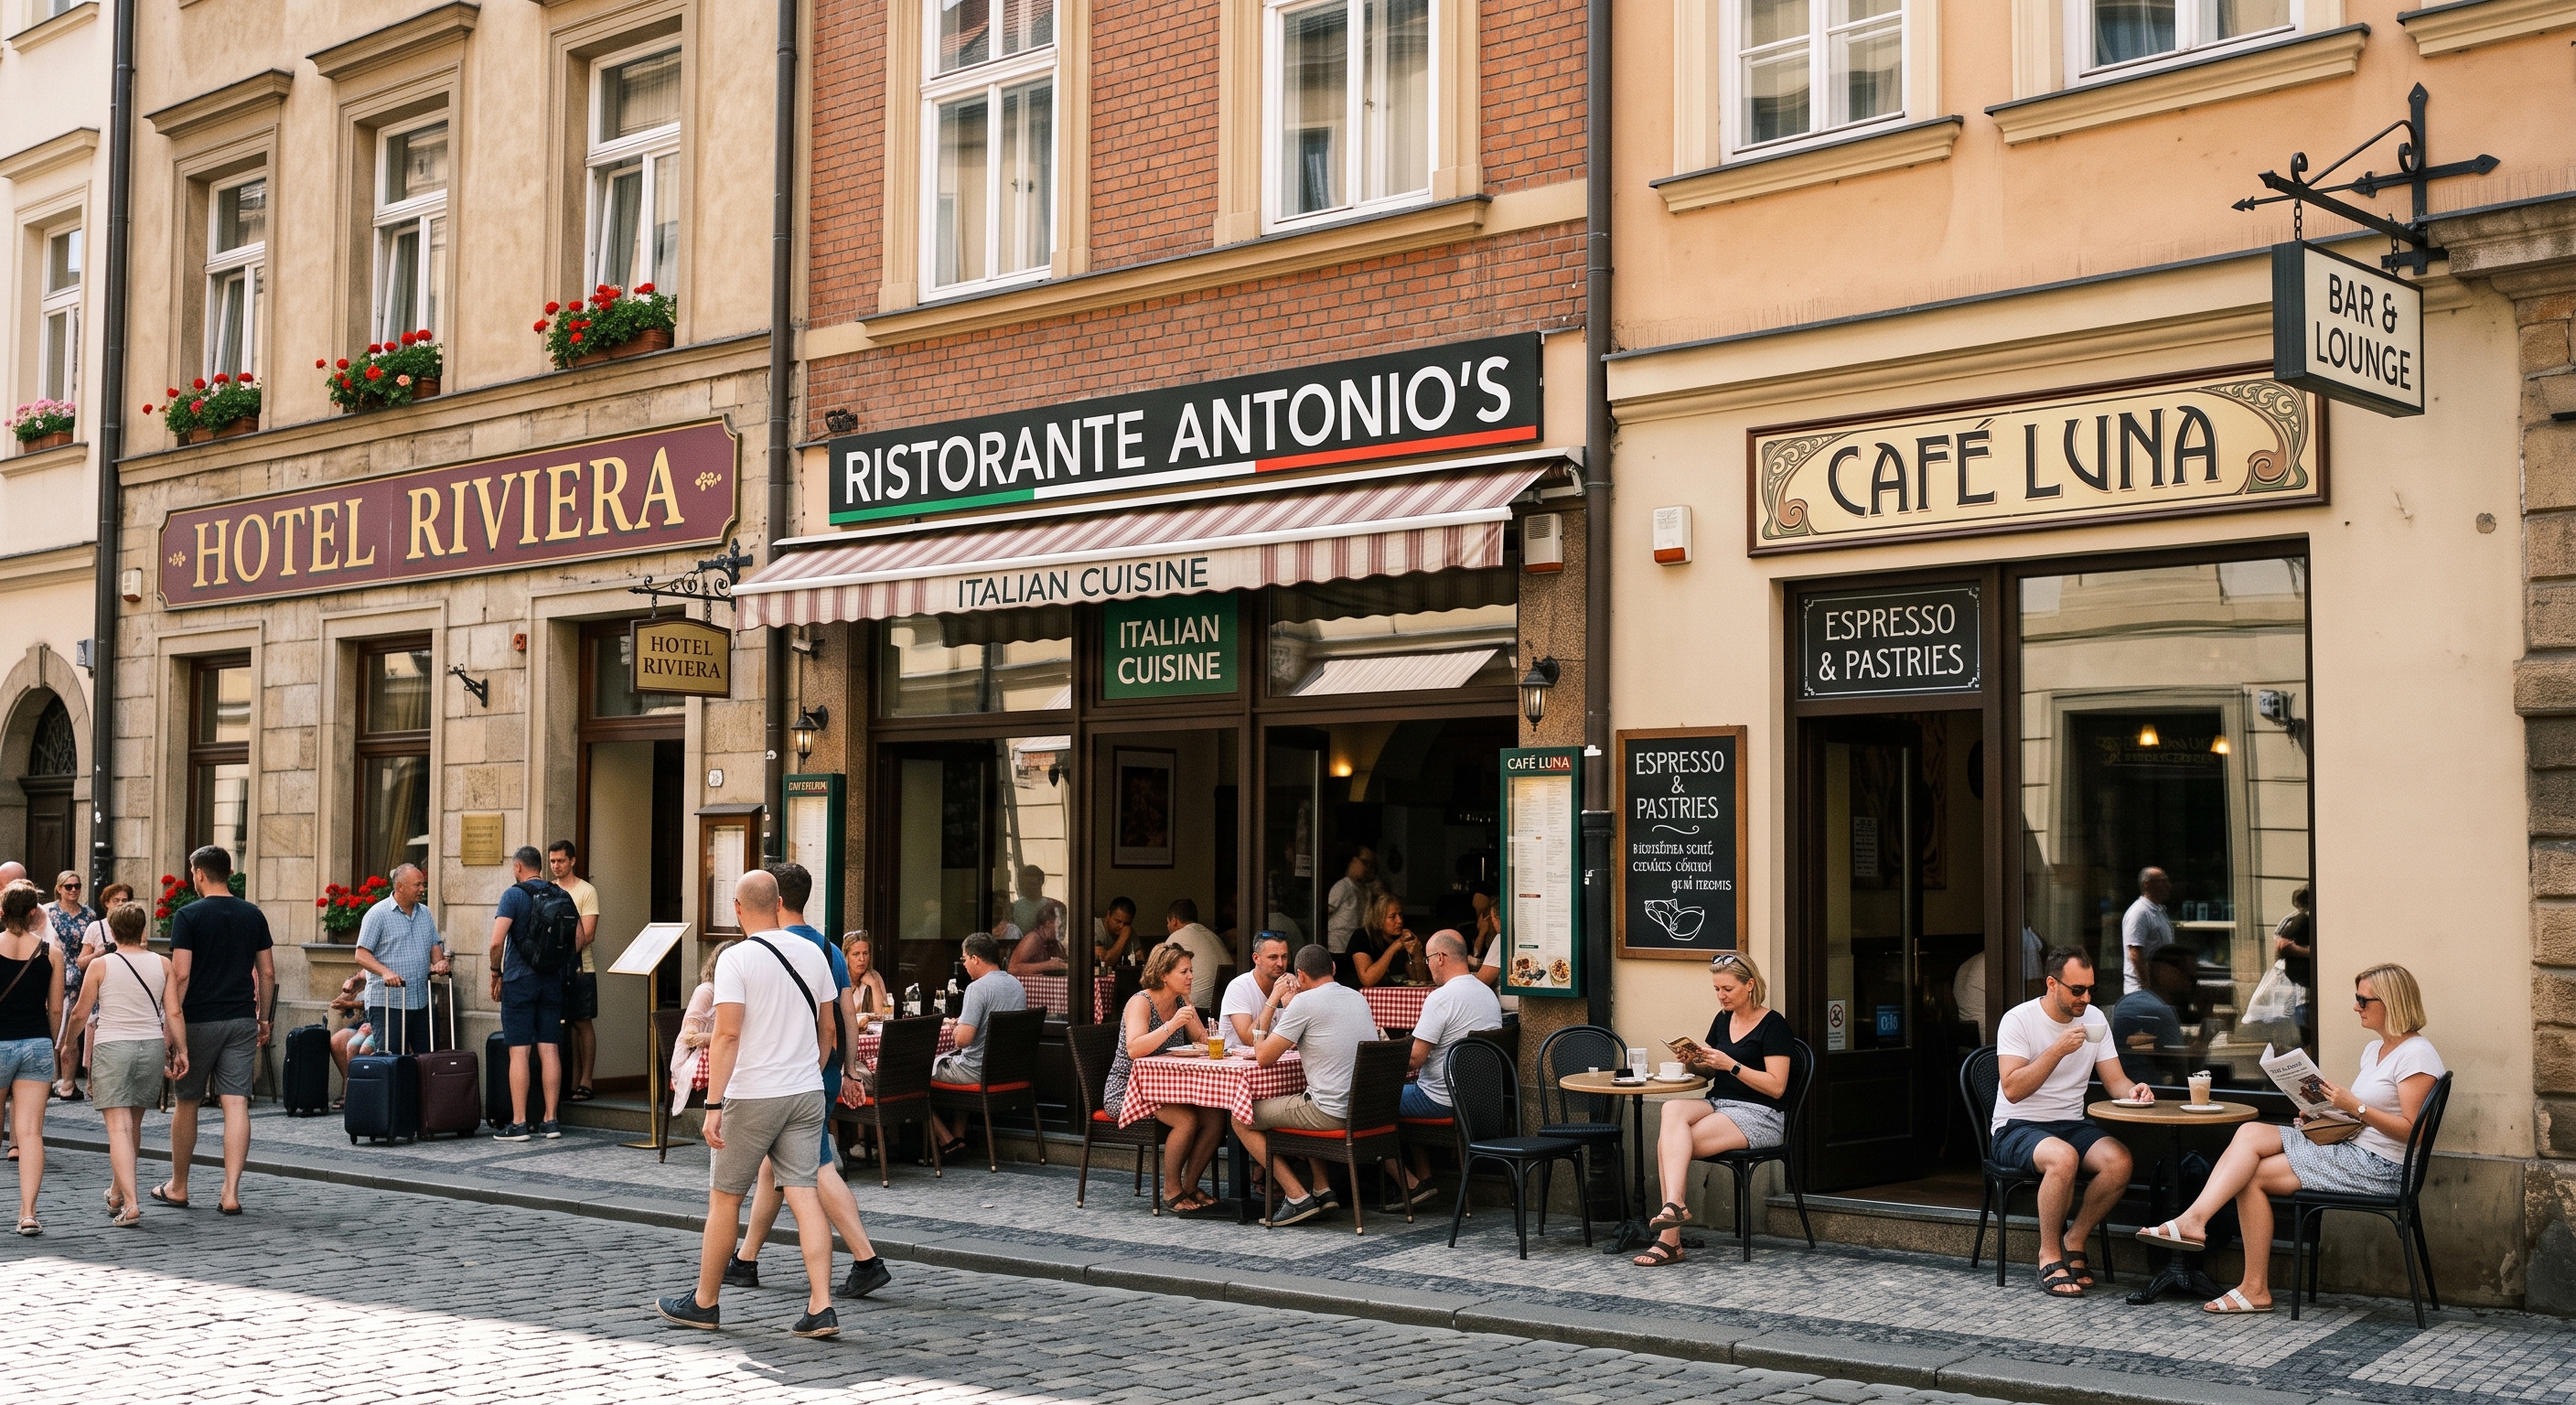
HoReCa is the channel where go-to-market plans go to be humbled.
The universe is huge (millions of independent bars, cafés, restaurants and hotels across Europe alone) and it changes constantly. Outlets open, close, change owners and change concepts faster than any field team can keep track of.
If your launch plan treats every outlet as equal, your sales reps will spend most of their time in places that were never going to buy.
The fix isn't more visits but better selection. Before you send anyone into the field, you need to know which outlets actually matter for your brand, and that comes down to a handful of indicators you can read for every outlet in your market.
Here are the ones that consistently separate a good HoReCa go-to-market from an expensive one. And because theory is cheap, we'll close by running them against a real market: Italy, all 545,000+ outlets of it.
1. Segment and subsegment: the first, brutal filter
Not every outlet can sell your product, and far fewer can sell it well. A premium gin belongs in mixology bars and fine dining, not in a roadside quick-service outlet. A plant-based dairy line lives or dies in cafés and coffee shops.
Segmentation sounds basic, but in practice most companies work with crude, outdated classifications: "restaurant" covering everything from a kebab shop to a Michelin-starred venue.
A modern outlet census splits the market into granular segments and subsegments (SharpGrid, for instance, uses 8 segments and 27 subsegments, from Beer House to Mixology Bar to Coffee Shop), so your first filter already removes the majority of outlets that will never be your customers.
What to do with it: define your ideal outlet profile at subsegment level, not segment level. "Bars" is not a target. "Mixology bars and alcohol bars in the top two engagement quintiles" is.
2. Revenue and volume potential: size the prize per outlet
Two cafés on the same street can differ by 5-10x in revenue. If you can't tell them apart, your reps will discover the difference the slow way, one meeting at a time.
Outlet-level revenue estimation (typically expressed as a percentile or quintile rank within the market, plus an estimated annual revenue range) tells you where the money actually is. Category-level potential goes a step further: an outlet may be strong overall but weak in spirits, or mid-sized overall but a beer powerhouse.
What to do with it: rank your target list by food & beverage potential in your category, and set coverage rules accordingly. For example: personal visits for the top quintile, telesales for the middle, distributor-only for the tail.
3. Consumer engagement and rating: demand you can borrow
An outlet's digital footprint (review counts, rating scores, social following, how fast engagement is growing) is the closest thing you have to footfall data without standing outside counting heads. A 4.8-rated restaurant with surging engagement pulls in exactly the traffic your brand wants to be seen by. A 3.2-rated outlet with declining reviews is a shrinking shop window.
Growth matters as much as the level. "Rising star" outlets, with good engagement that's growing fast, are often the best acquisition targets: hungry for good offers, not yet locked into competitor contracts, and about to get more valuable.
What to do with it: treat engagement rank as a demand proxy in your outlet scoring, and flag engagement growth separately. Champions keep your volume; rising stars grow it.
4. Menu and brand presence: see the shelf before you visit
In HoReCa, the menu is the shelf. What's listed, at what price, in what serving size: that's your distribution reality and your competitor's, outlet by outlet. Digital menu data can tell you that an outlet pours a rival lager on draft at a given price, or that it lists no energy drink at all (a white space), before your rep ever walks in.
Menu penetration is arguably the single best proxy for brand health in the channel: it's objective, observable, and refreshed continuously. No panel, no survey.
What to do with it: build two lists from menu data. First, conversion targets: outlets stocking competitors where you have a credible switch story (price gap, portfolio, support). Second, white spaces: outlets that sell the category but not your brand. These are often the cheapest potential wins for you.
5. Price level: match your proposition to their positioning
An outlet's price level, whether read from menu prices or price-tier buckets, tells you instantly whether your premium SKU or your value pack is the right conversation. Pitching a super-premium spirit into a bottom-decile-priced pub wastes a visit; pitching a value brand into a fine-dining venue wastes your brand equity.
What to do with it: segment your portfolio pitch by outlet price bucket, and hand reps the expected price positioning before the meeting so the first offer lands in the right range. In a nutshell, pitch the right part of the portfolio at the right price and with the right set of incentives.
6. Activity status and closed outlets: don't sell to ghosts
The quietest killer of HoReCa productivity is stale data. In a typical market, a meaningful share of outlets changes status every quarter: closures, reopenings, new concepts under new names. Reps navigating an old database burn hours driving to outlets that no longer exist, while newly opened outlets (the most acquisition-friendly moment in an outlet's life) get discovered by whoever shows up first.
What to do with it: work only from a source refreshed at least quarterly, and put "recently opened" outlets in a dedicated fast-response workflow. New openings have no incumbent supplier loyalty yet. That window closes quickly.
7. Chains vs. independents: two different games
A chain of forty cafés is one negotiation with forty outlets of upside; forty independents are forty negotiations. Chain data (size, expansion rate, average outlet potential, dominant segment) tells you which chains are worth a key-account approach and which are quietly expanding into your territory.
What to do with it: split your go-to-market motion explicitly. Route chains and "operating groups" (same operator, different formats) to key-account management; route independents through territory-based field sales, prioritized by the indicators above.
A real-world look: Italy, by the numbers
Here's what these indicators look like on a live market.
The latest SharpGrid Outlet Census snapshot of Italy counts 545,248 active HoReCa and leisure outlets: 158,333 accommodation, 141,866 restaurants, 83,598 bars, 70,339 cafés, 52,615 leisure & entertainment venues, 25,886 quick-service outlets, 9,062 pubs and 3,549 clubs.
In this single quarter alone, 8,985 outlets were newly added. That's the churn from section 6, happening in real time.
Now watch what the indicators do to that universe for, say, a spirits brand planning a launch:
- 545,248 active outlets → 96,209 bars, pubs and clubs (segment filter)
- → 77,496 that actually list spirits on their menu
- → 33,059 in the top two consumer-engagement quintiles
- → 28,524 that are also in the top two food & beverage revenue quintiles
Four indicators turn a 545,000-outlet market into a 28,524-outlet target list: about 5% of the universe, and the 5% where a rep visit is most likely to pay for itself. Layer on growth and it gets sharper still: 9,674 of those spirit-selling bars, pubs and clubs are classified as Rising Stars, outlets whose engagement is climbing fast and who are most open to new suppliers. Market-wide, the census flags 80,002 Champions and 51,992 Rising Stars.
Menu data tells the competitive story too, and in Italy it tells a surprising one.
Jack Daniel's leads whisky menu presence with roughly 1,800 outlets, but the next names are single malts: Talisker at about 1,500, Lagavulin at 1,480, Oban at 1,330 and Laphroaig at 1,320.
Italian venues that list whisky skew premium. If you're a challenger brand in that list, the gap between you and the leader isn't an abstraction anymore. It's a named, mapped, addressable set of outlets.
Putting it together: from indicators to an outlet score
None of these Sharpgrid indicators work alone. The point is to combine them into a single, explicit scoring model: hard rules that exclude outlets that can't buy (wrong segment, inactive, no alcohol license), and weighted soft rules that rank everyone else (potential, engagement, menu fit, price match).
Once every outlet in the market carries a score, everything downstream gets easier: territory design, target lists, rep routing, launch sequencing, and an honest answer to "how big is the opportunity, really?"
This is essentially what platforms like SharpGrid's Outlet Census do at channel scale: a continuously refreshed digital census of every HoReCa outlet in 61 markets, with 50+ indicators per outlet, so the scoring runs on live data instead of last year's field notes.
Clients like Unilever Food Solutions have used this approach to lift new customer acquisition by over 300%; Mattoni finds 90% of its new opportunities this way. The underlying principle, though, holds whatever tools you use: in HoReCa, the winners aren't the teams that visit the most outlets. They're the teams that know which outlets to visit.
One last practical rule: let data do what data does best. Your field team should only collect the handful of things that can't be observed digitally, like contract expiry dates, decision-maker names and competitor agreements.
Everything else in this article is already out there, collected by Sharpgrid for you. If you wanna give it a go, try our Outlet Census for free now.