The Invisible On-trade Data You're Not Using and How to Benefit From Them


Every day, millions of beverage menus update online. While most view these simply as digital drink lists, they actually represent the most dynamic, honest & hottest dataset in the industry.
Hidden within these digital pages is a massive amount of actionable intelligence: exact product distribution, real-time pricing fluctuations, and segment-specific trends.
When you aggregate this data, it stops being a list of drinks and becomes a map of the market.
It reveals who is winning the distribution war, where the premium pockets are, and where your competitors have left the door open.
Here is what Sharpgrid data is telling us about the current state of the market and how can you benefit from all this with our new Brand Insights 2.0.
The Reality of Market Penetration
Are you actually leading the market, or just the generalized statistics? Menu penetration serves as the ultimate proxy for brand health. It cuts through the noise of shipment data and tells you exactly how often you appear in front of the consumer.
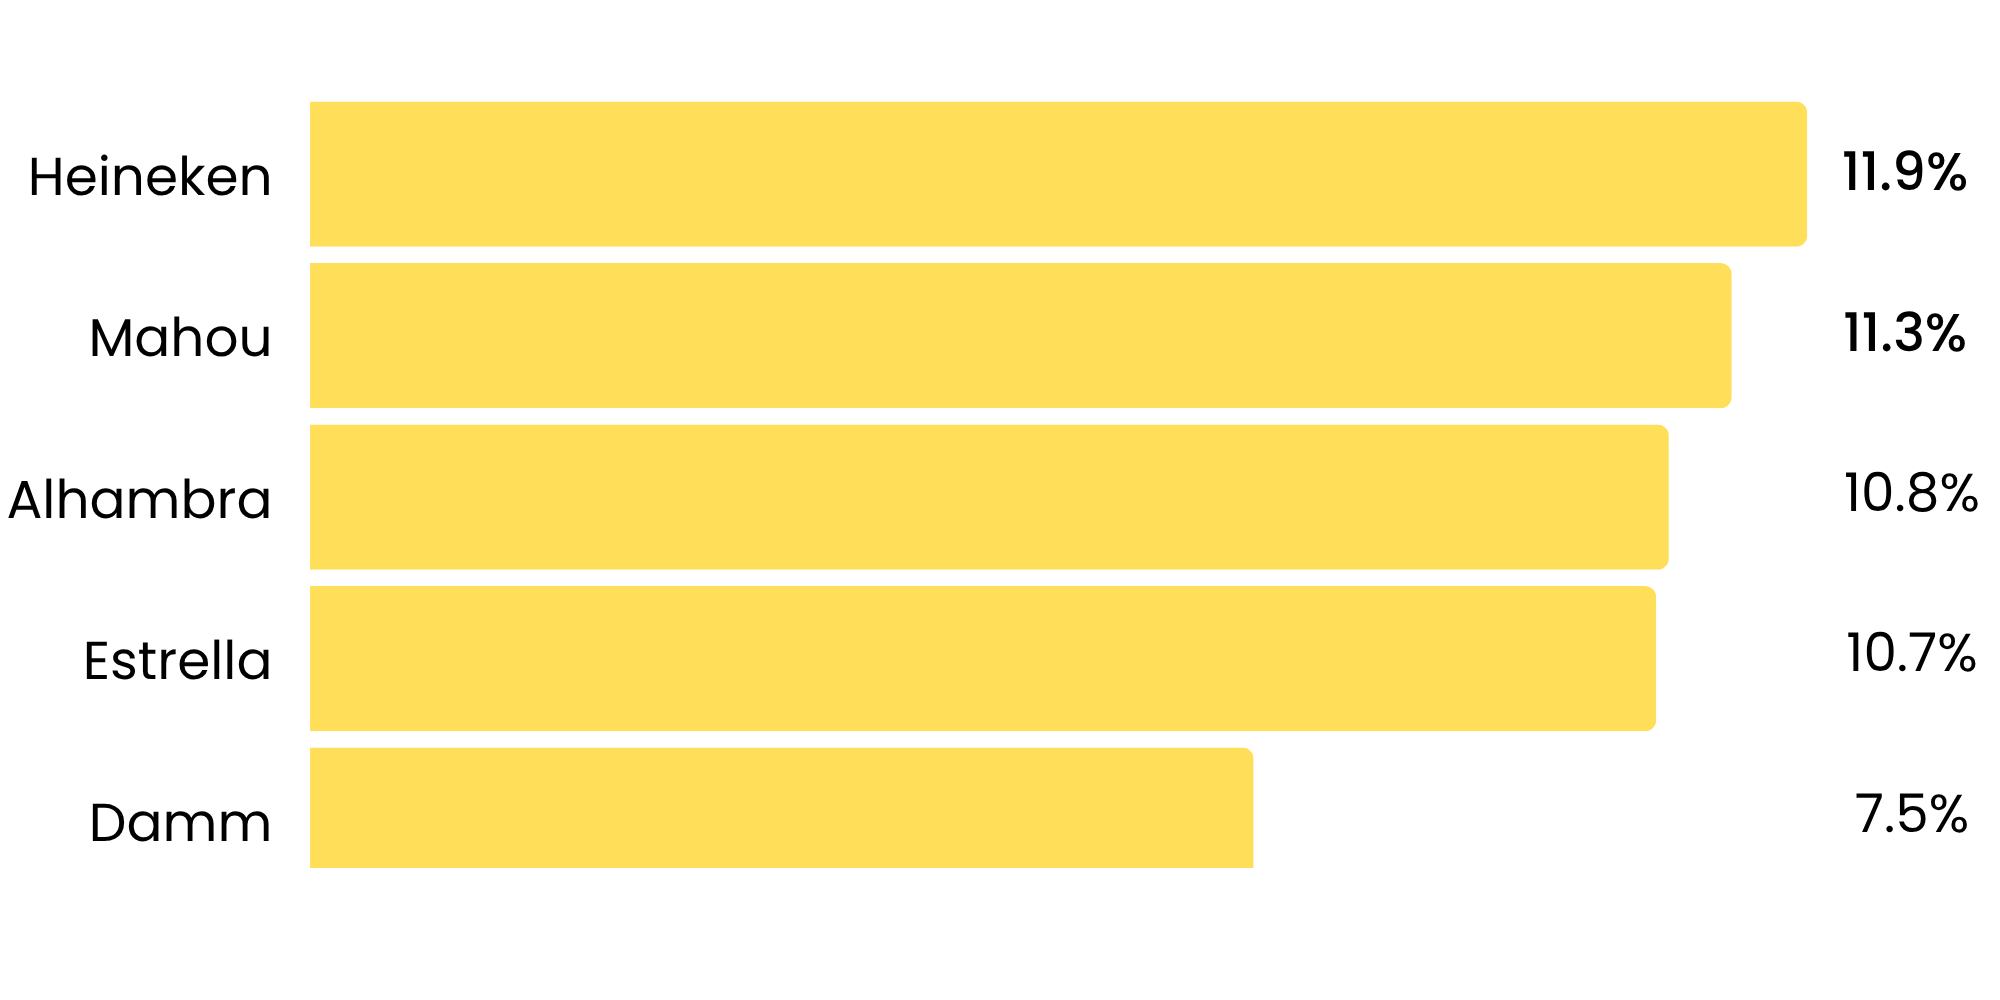
For example, in the fiercely competitive Spanish beer market, the current data shows Heineken is holding a slight edge with 11.9% menu penetration, followed closely by Mahou (11.3%) and Alhambra (10.8%). Knowing these exact margins allows you to target specific territories and tip the scales in your favor.
Ask for Brand Insights demo - now part of the Outlet Census Live
The Danger of Averages (Market Segments)
A broad "national average" often hides the real story. To truly understand performance, you have to drill down into specific venue types.
As we see in the UK gin market, a surface-level look suggests a stalemate: both Bombay and Tanqueray hold a 9.6% overall menu penetration with almost no regional difference.
However, when you filter by venue type, the picture changes strictly. In the "Bar" segment, Tanqueray dominates with 24.9% penetration compared to Bombay’s 14.6%. If Bombay relied only on the national average, they would miss the fact that they are significantly underperforming in the high-volume bar scene.
.png)
Finding the "Premium" Pocket
Beyond simple distribution, cross-referencing availability with outlet ratings and pricing creates a "popularity" engagement metric. This reveals where brands are punching above their weight class.
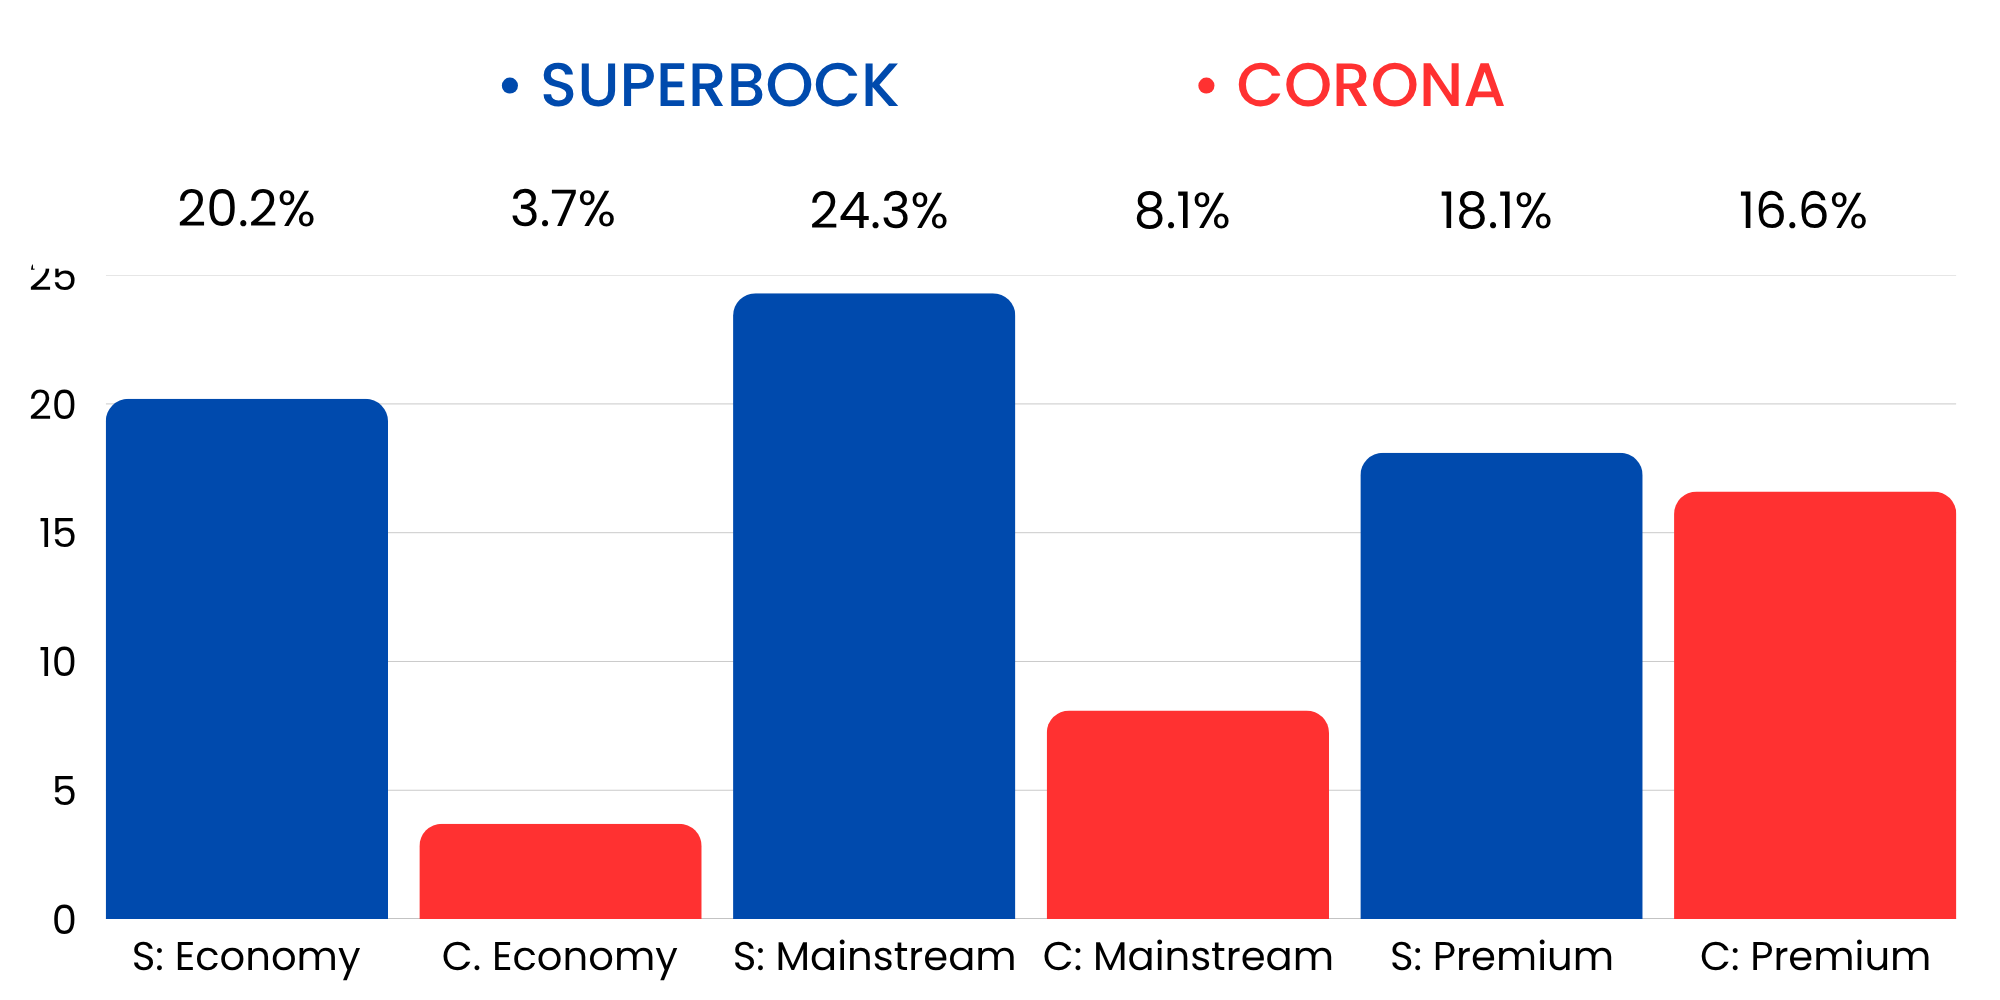
Like in Portugal where Superbock has much wider distribution than Corona but the gap virtually disappears in the Premium segment. Because Corona is skewed towards more expensive, high-end outlets, it rivals Superbock’s presence where it matters most for brand image. Both brands can use this insight: Superbock to defend its mass-market dominance, and Corona to double down on its premium positioning.
Ask for Brand Insights demo - now part of the Outlet Census Live
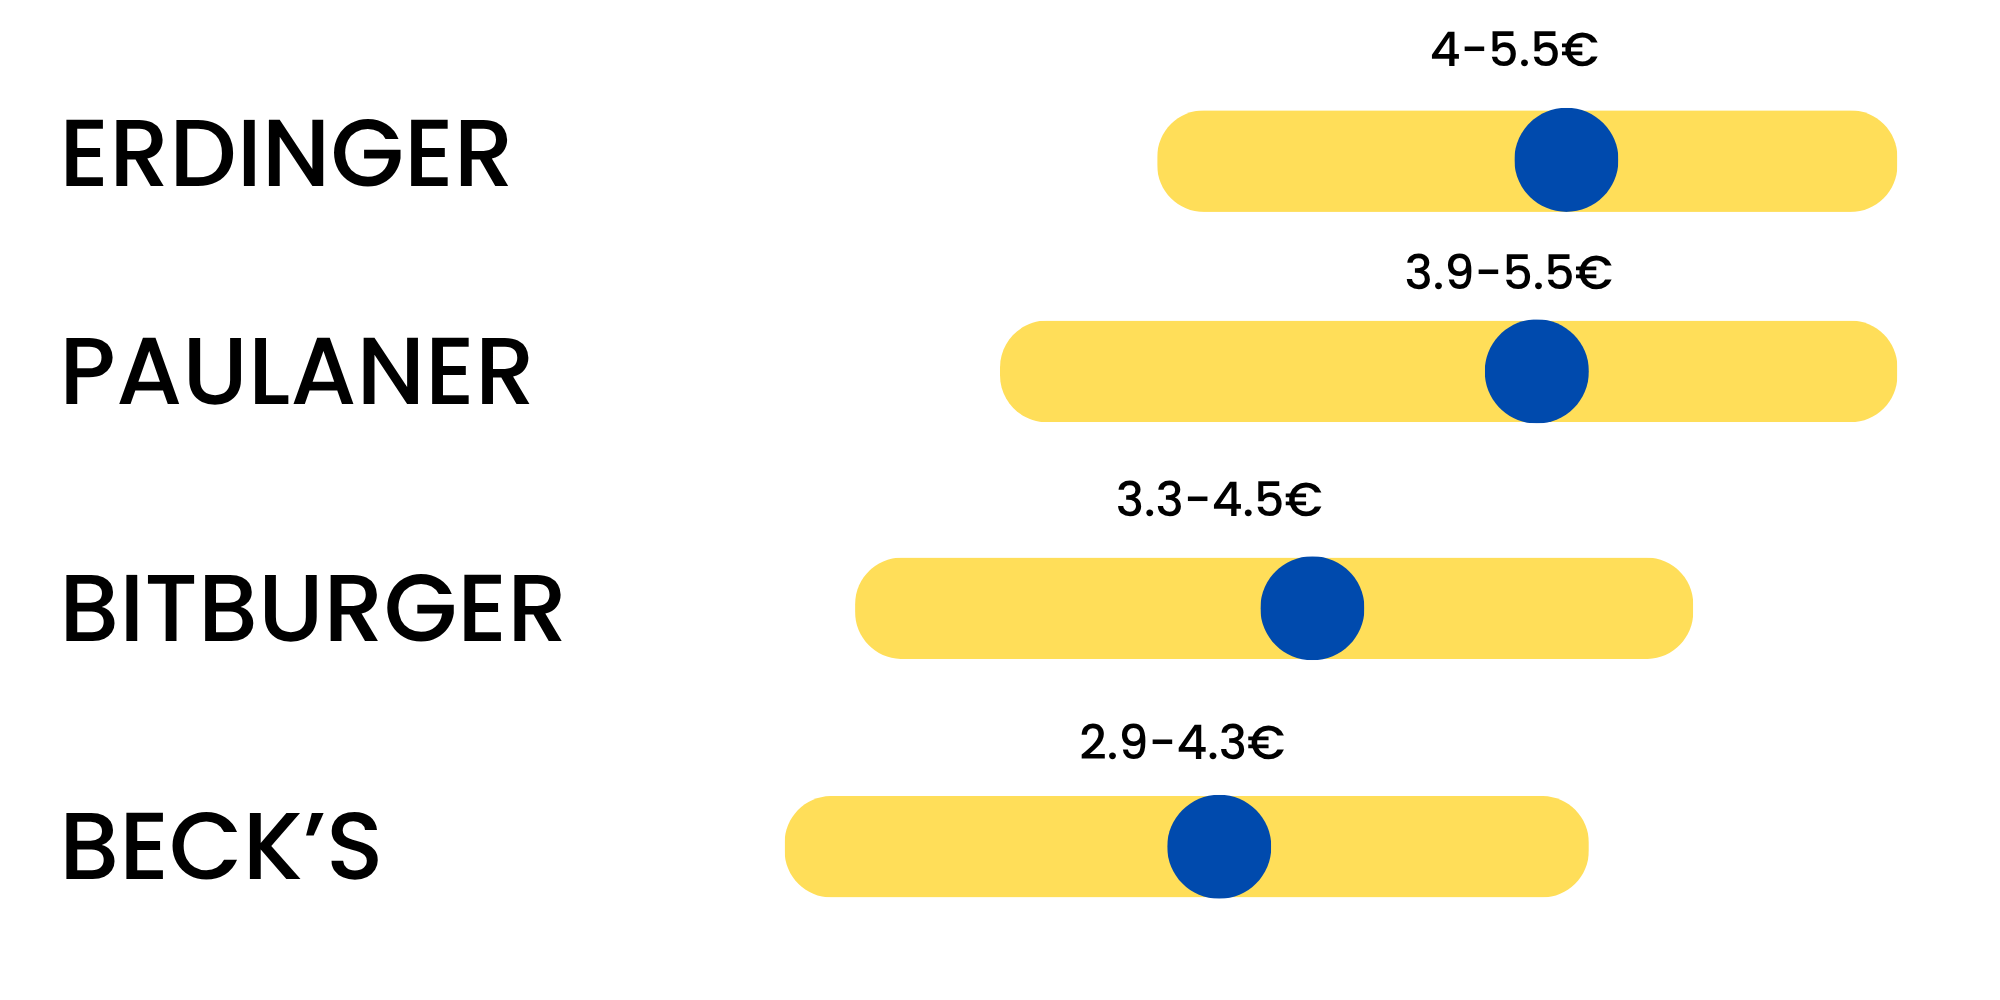
Pricing is the Key
Finally, visibility means nothing if the price point is wrong. Monitoring the "price per serving" across major categories is the only way to ensure your strategy isn't being undercut by market realities. You need to know if your desired premium positioning is actually being reflected on the menu, or if retailer pricing is eroding your brand equity.
Turn These Insights Into Strategy
The examples above like optimizing pricing, spotting segment gaps, and identifying competitor weaknesses are not hypothetical. They are derived from the new Brand Insights 2.0 report within Outlet Census Live.
We built this engine to give you the granularity needed to stop guessing and start targeting. Whether you need to create data-backed price change suggestions for customers or identify underserved areas, the data is ready.
Ready to see your brand's numbers? Schedule a quick demo with our team to get 3-day free access and start exploring these use cases today.