Drilling down through the Italian on-trade: What does an analysis of all individual outlets tell us about the market structure and potential?


.png)
This year, we have launched the Italian version of SharpGrid Outlet Census, a BI tool for granular view of the on-trade market and deep understanding of all the 390 806 Italian on-trade outlets (as of Q3 2022). SharpGrid Outlet Census provides a next-gen accuracy and granular analysis of on-trade market structure and potential, while also enabling a fact-based design of the route-to-market strategy with proven track record. This research is based on its data.
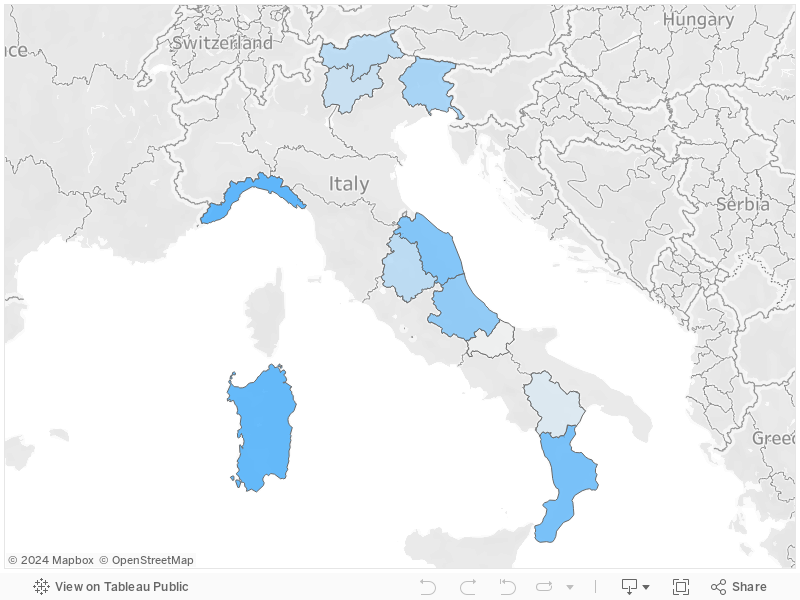
Italian on-trade market structure: Regions
In this interactive map you can see all the Italian regions and their outlet count.
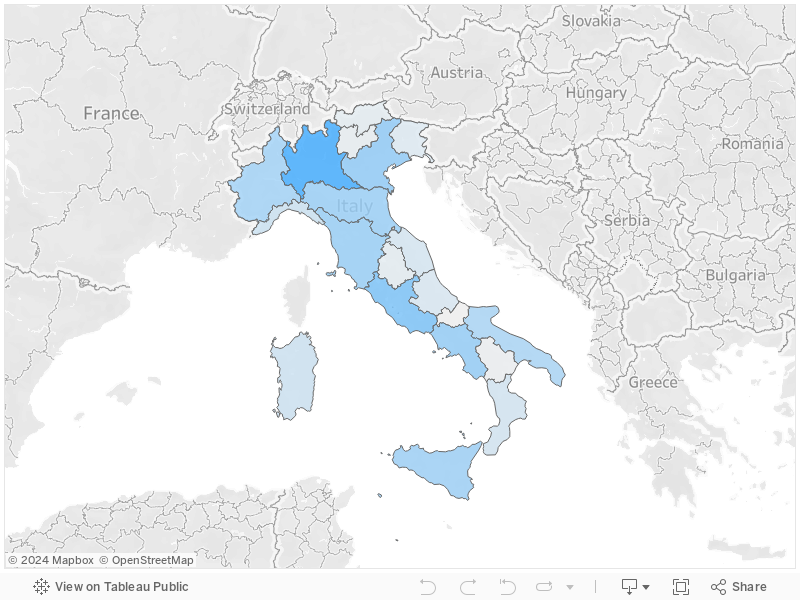
Note: Maps in this article show the region Trentino-Alto Adige/Südtirol as 2 separate regions as they are based on the NUTS statistical nomenclature.
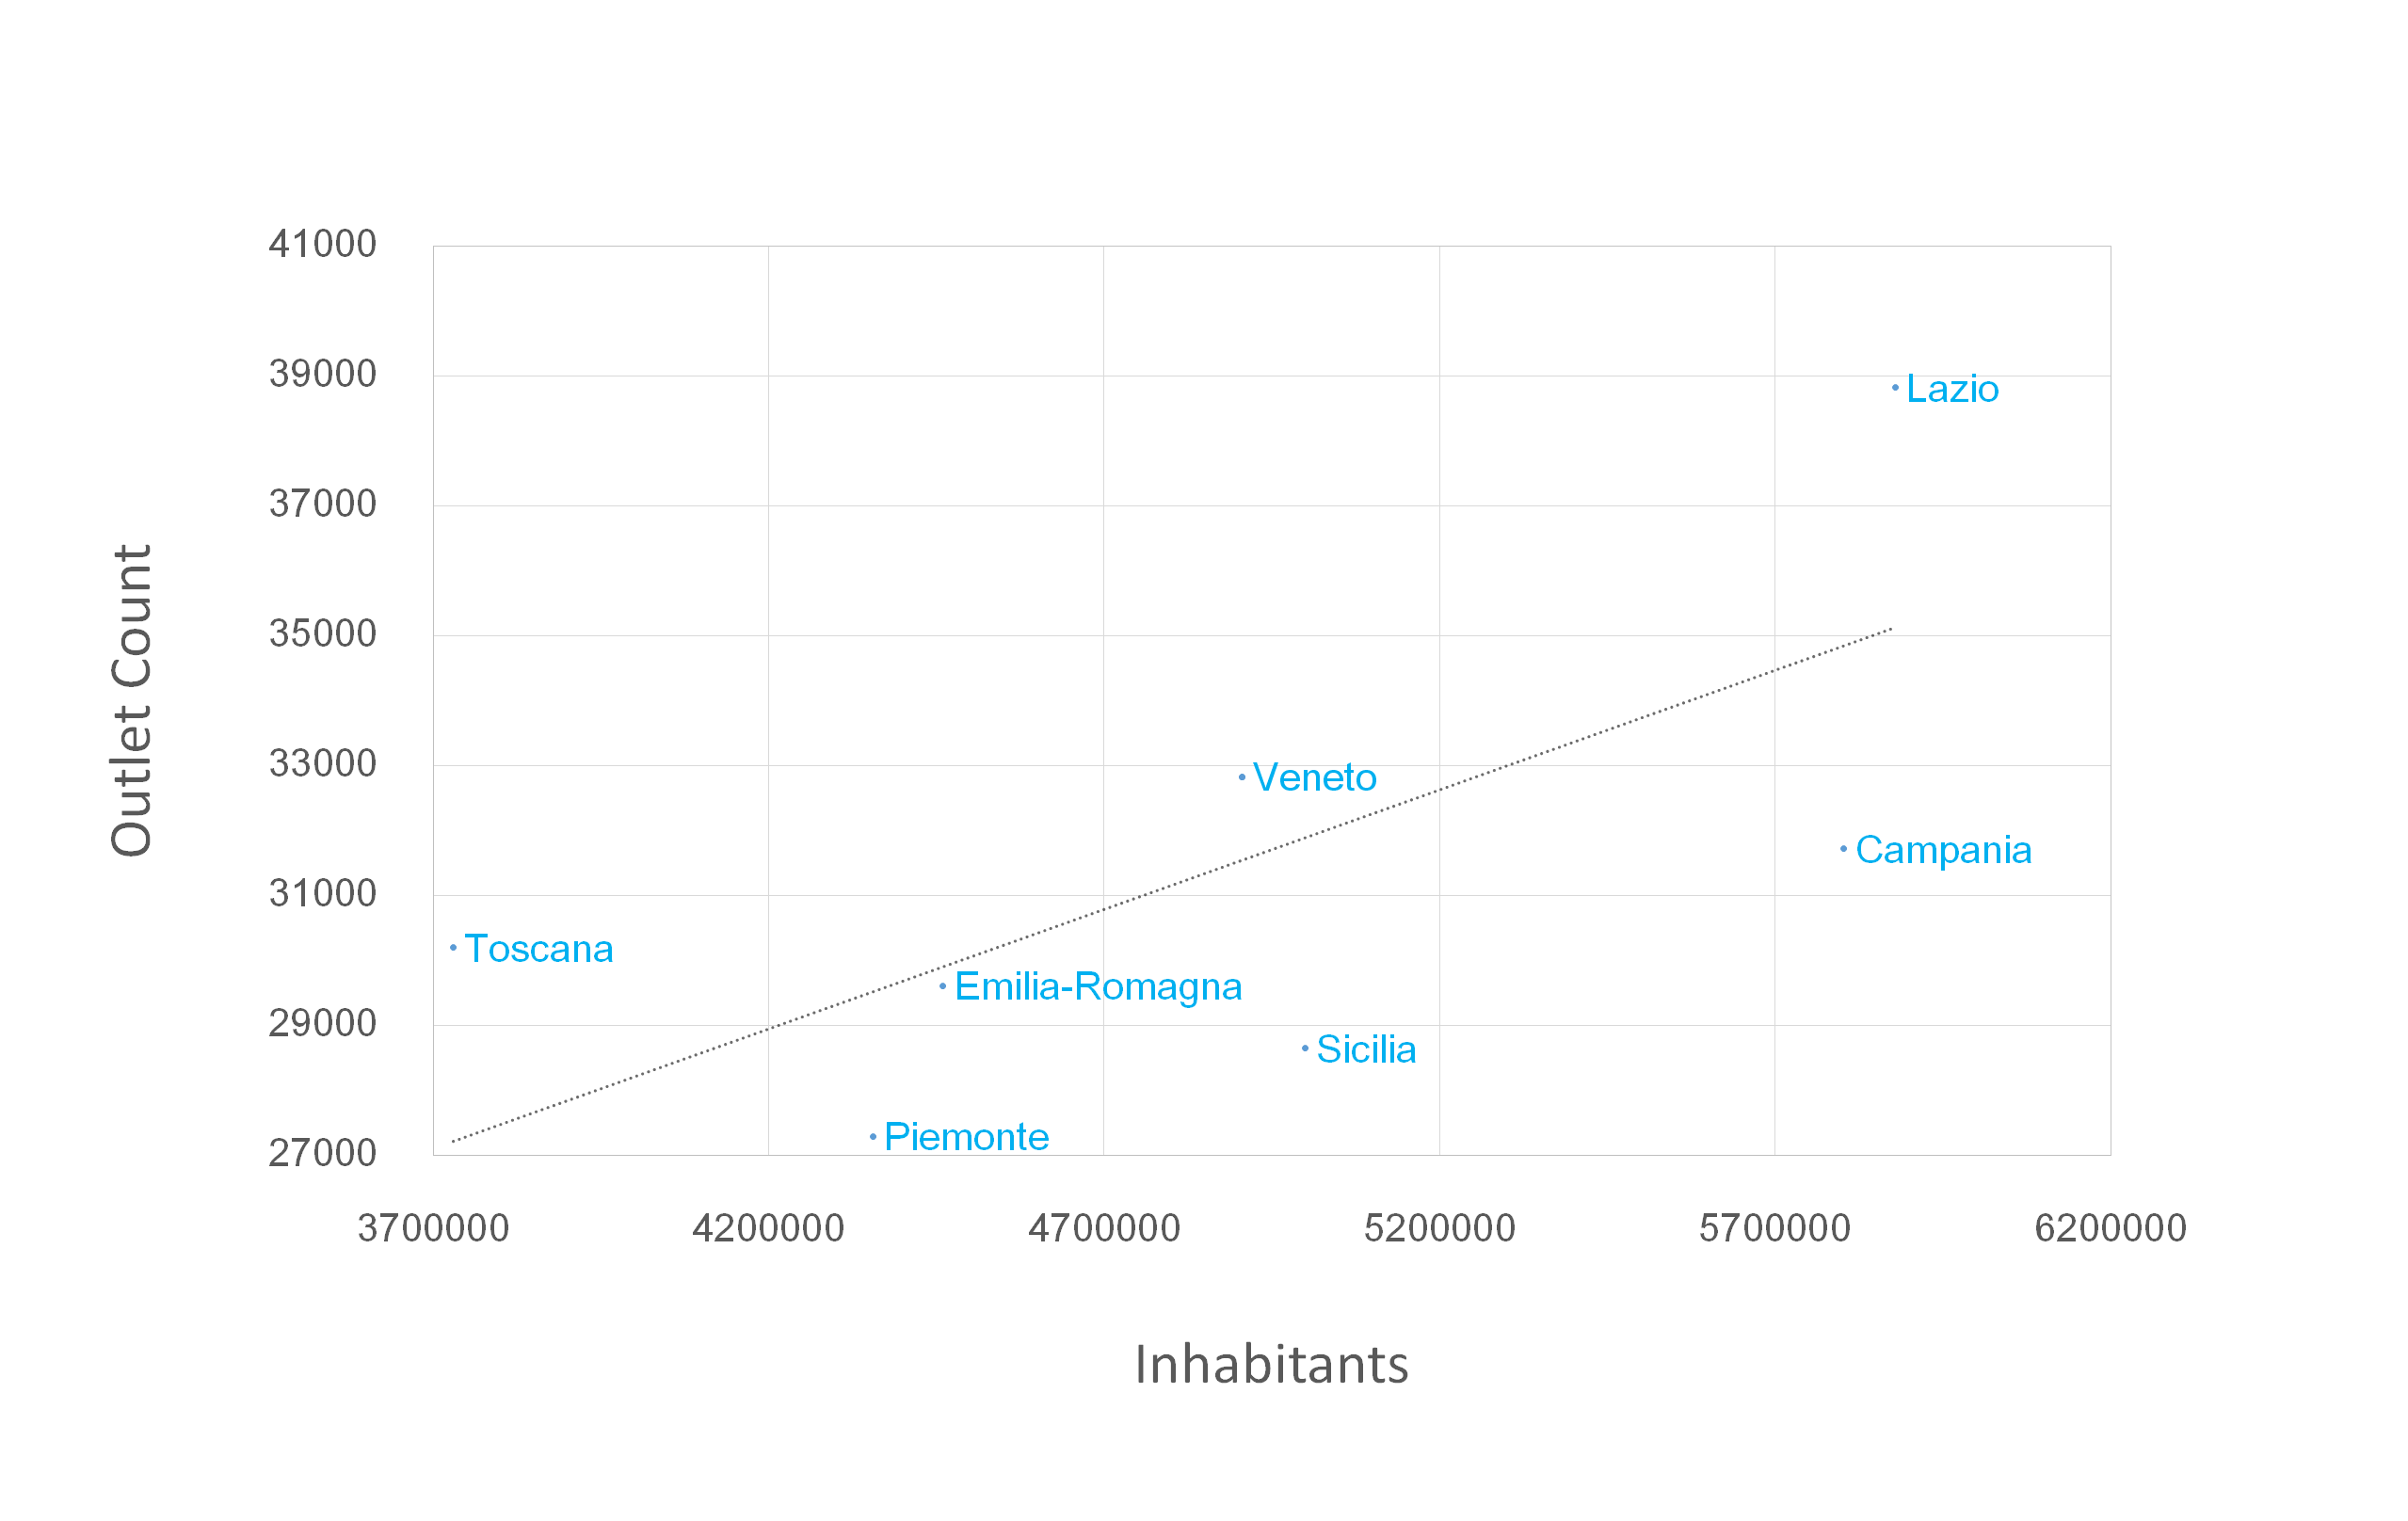
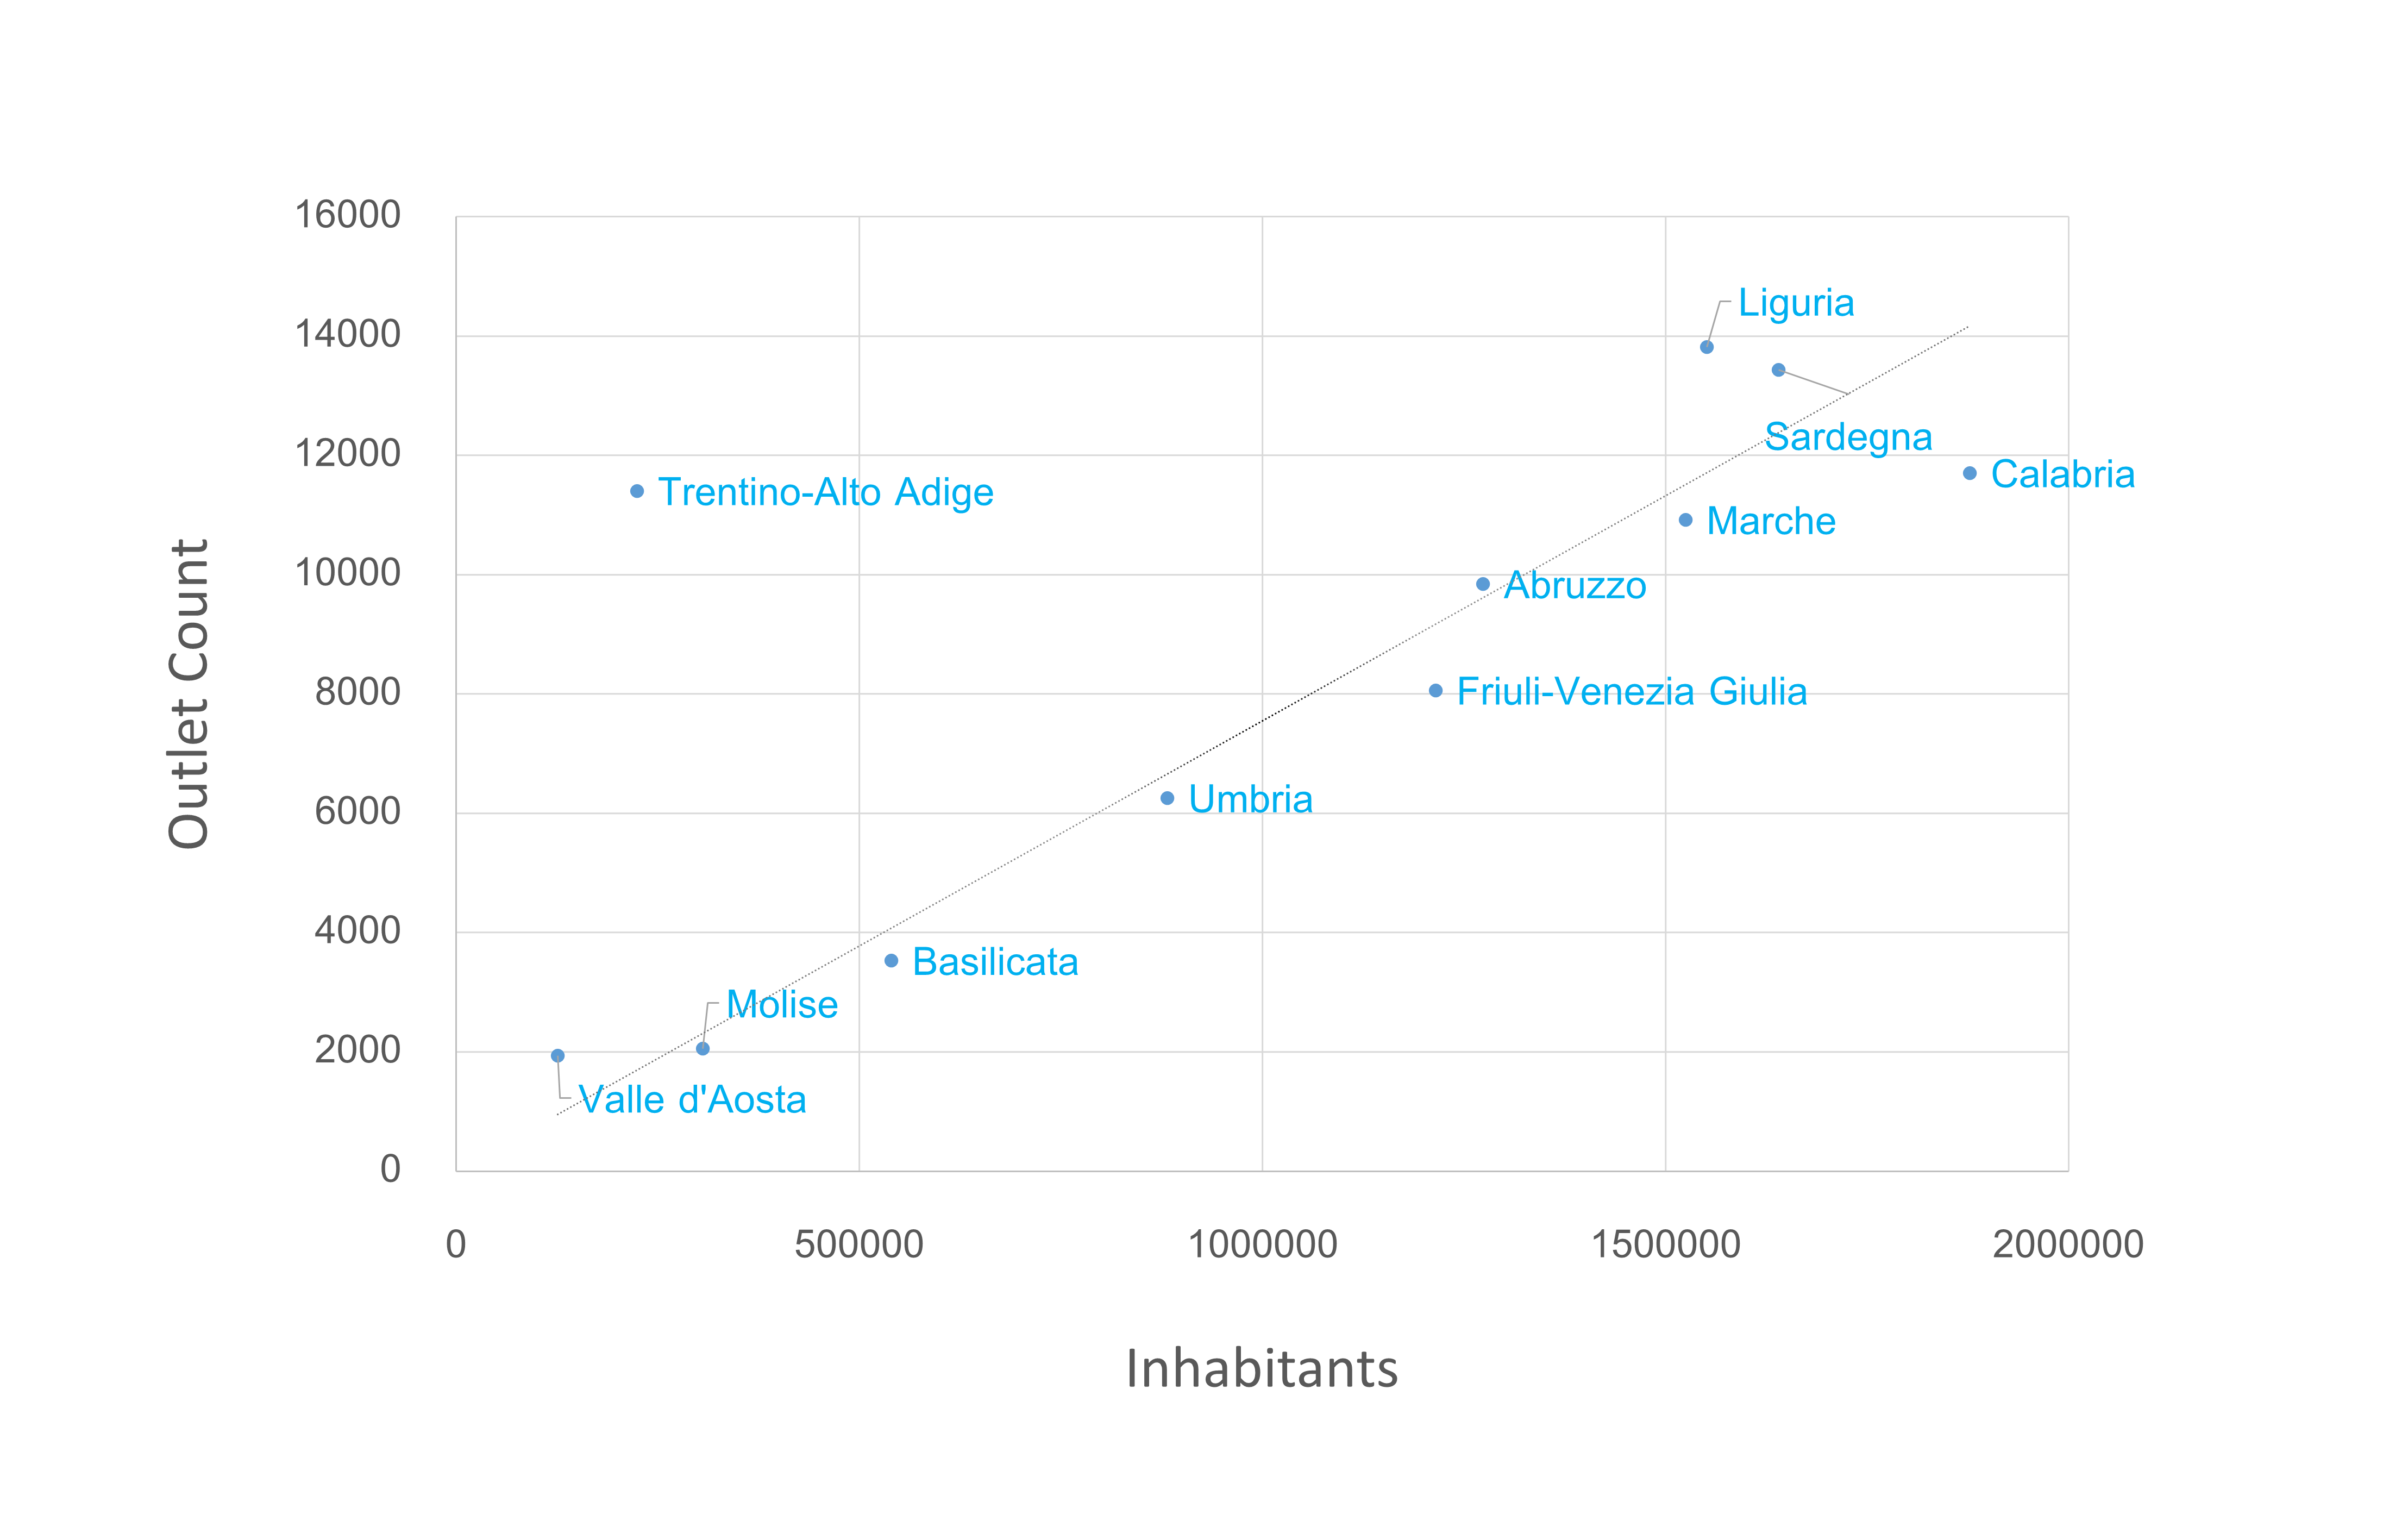
But let’s look at the market structure in terms of outlet density (on-trade outlets per population). In other words, which regions are the most important from the beverage producer or vendor perspective.
.png)
You can see 3 clusters in the chart above. Let’s look at them in detail.
Cluster 1: Lombardy: Large and attractive
The region of Lombardy is in a category of its own. It is home to 17% of all Italian population and 14% of the country’s on-trade outlets.
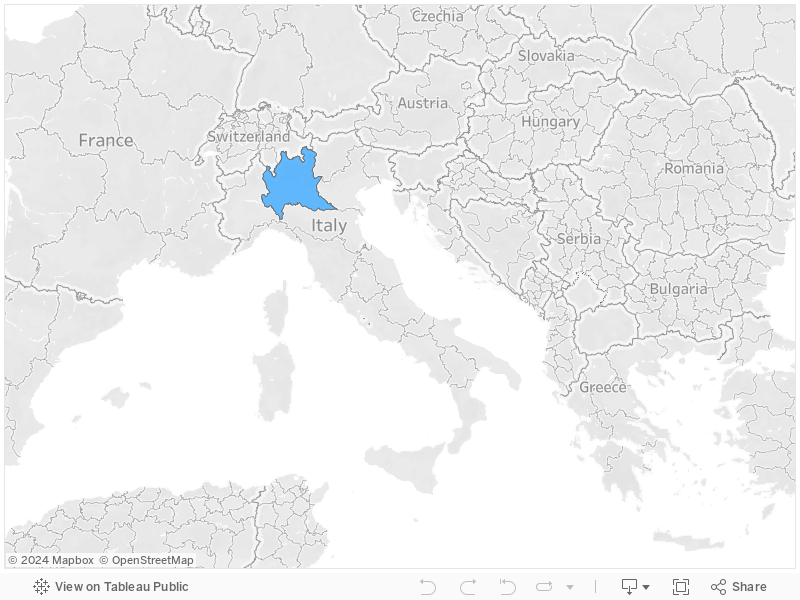
Its outlet density is low (5,6 outlets per 1000 inhabitants which is 15% lower than the Italian average of 6,6) and it has slightly higher engagement rate per outlet than average in Italy (322 vs 309 respectively). In fact it shows a very similar profile as Cluster 2. What differentiates Lombardy versus the rest of the country is its sheer size and geographical concentration of the on-trade outlets.
Cluster 2: The core of Italian on-trade
This cluster consists of 8 regions that make up 66% of Italy's population and 64% of all on-trade outlets in Italy. Targeting and succeeding in this cluster ensures that one has covered well ⅔ of the Italian on-trade!
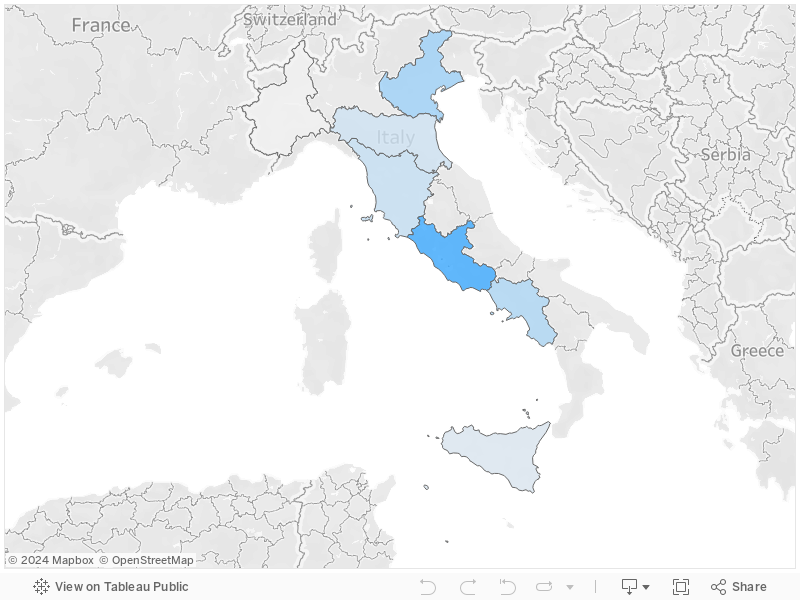
Outlet density in Cluster 2 is almost identical to the national average (6,5 outlets per 1000 inhabitants compared to 6,6). Same goes for the average consumer engagement per outlet (319) which is only slightly above (3%) the Italian average (309).
This indicates that this cluster is clearly the core of Italian on-trade and is representative of the country’s on-trade potential. It also includes many of the most visited regions in Italy by tourists.
Cluster 3: Fragmented but important
These 12 regions make up 19% of Italy's population and 24% of all on-trade outlets in Italy. The outlet density in this cluster is substantially (26%) higher than the Italian average (8,3 outlets per 1000 inhabitants vs 6,6). However, the average consumer engagement per outlet is 18% lower than the country average (262 vs 309), suggesting lower average customer traffic and potential per outlet than in the rest of Italy.
Interestingly, the 2 regions with the highest outlet density in Italy are in this cluster: Trentino Alto-Adige (50,9 outlets per 1000 inhabitants) and Valle d’Aosta (15,4 outlets per 1000 inhabitants). Both regions are mountainous regions and the vast majority of on-trade consumers here are tourists (e.g. only in the Trentino-Alto Adige region our analysis suggests tourists' share of on-trade customers is over 80%). Also the percentage of on-trade outlets that operate as a part of accommodation service is over 30% of total, almost double the national average.
Covering this cluster of regions in the on-trade well appears to be relatively more challenging than the rest of Italy, given both smaller average region size and lower outlet potential, often scarcely populated mountainous regions and specific demands of tourists that one needs to accommodate. On the other hand, this cluster represents almost a quarter of all of the Italian on-trade and several wealthy areas of the country.
Clusters and the route-to-market approach
So what are the additional learnings from the outlet analysis? One can draw a potential roadmap for on-trade expansion and growth in Italy as follows:
- It starts in Cluster 1 in Lombardy, the region with highest business potential but also the most competitive
- Continues to Cluster 2, the core of Italian on-trade and its “must cover” regions.
- And finally moves to Cluster 3, which encompasses almost 25% of all on-trade outlets but is more fragmented, dispersed and more challenging to cover efficiently.
The “city by city” view of the on-trade channel
An interesting alternative to looking at the market by region is to take a “city by city” approach. This approach is useful when determining the best route-to-market strategy and can tell you a lot about where the most on-trade “action” is taking place. Let’s look at the chart comparing % of national population and outlets concentrated in the top 10, 20 and 50 biggest Italian cities to determine their outlet density.
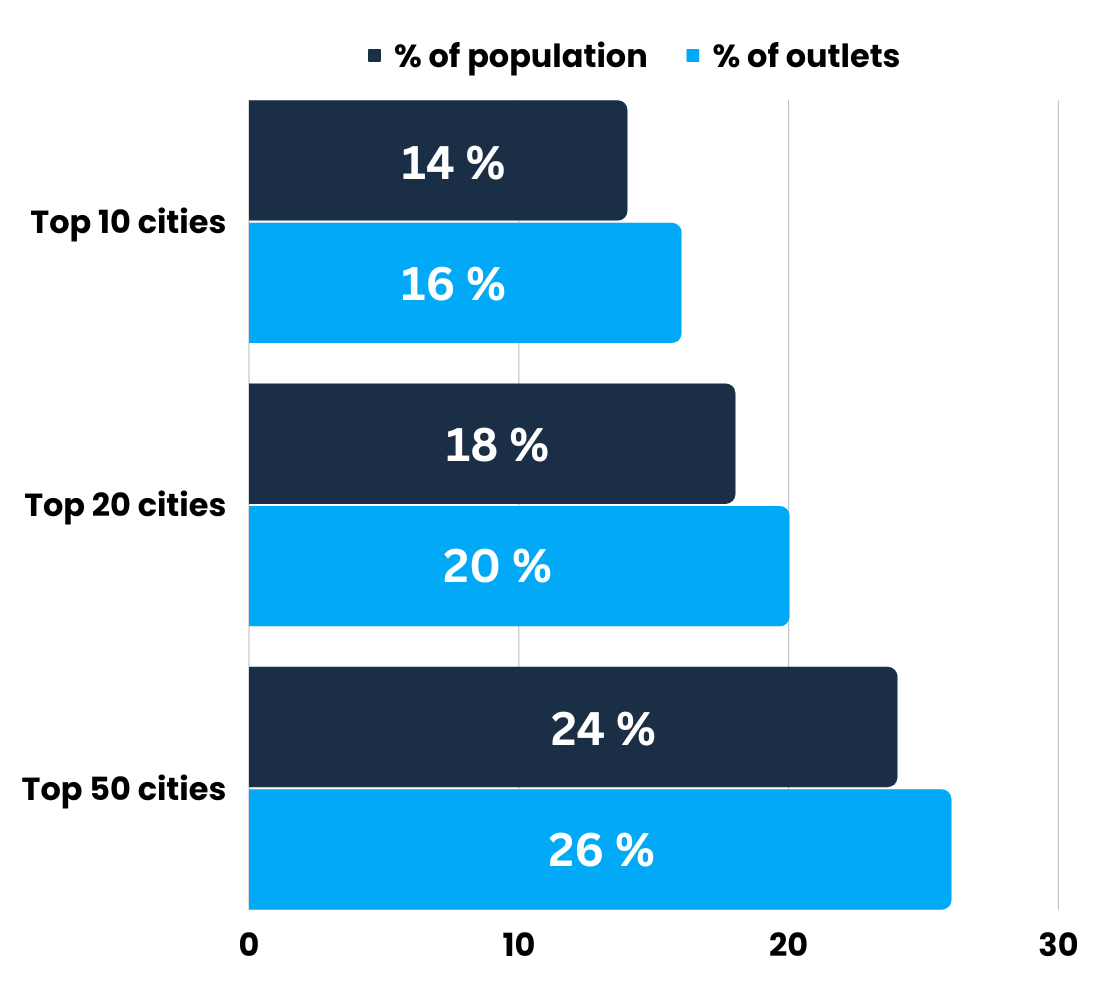
The conclusion? The outlet density in the biggest Italian cities is in line with population. Therefore there are no clear advantages on focusing on Top cities first in terms of building market coverage. Also, the biggest 50 cities host less than ¼ of the Italian population and just 26% of all outlets. Therefore, to succeed on the Italian market one has to focus not only on major cities but on the myriad of mid-sized and smaller cities and even villages as a lot of them could be popular tourist destinations.
Focusing exclusively on the largest cities does not appear to be the preferred strategy for Italian on-trade players.
This results are quite similar to the Spanish on-trade market analysis we’ve done in the past but very different to e.g. the United Kingdom or the Polish on-trade which is much more concentrated in major metropolises.
READ MORE: Spanish on-trade market analysis
READ MORE: Poland on-trade market analysis (an interview with Karolina Wysłucha)
However, we are just scratching the surface and looking at the market on a very aggregated level. If you want to understand the opportunities in the on-trade market on a truly granular level, outlet by outlet, to look at cities, districts or streets, taking into the account parameters like an outlet potential, price level or its offer & cuisine, get in touch with us and we will share with you what our Outlet Census can help you determine about the Italian on-trade channel.
SharpGrid is a data & tech company reinventing market research in the on-trade channel. The on-trade channel consists of POSs (points of sale) like restaurants or bars where food & beverage is bought and consumed, and is often also called HoReCa, on-premise, food service, out-of-home, gastro or immediate consumption (IC) channel, hospitality or on-licence.